Approximate Breakdown of Police Time Use in the U.S.
| Category | % of Police Time | Notes |
| Serious violent crimes | 4–6% | Includes homicide, rape, robbery, aggravated assault. |
| Property crimes | 10–12% | Includes burglary, theft, vehicle theft, arson. |
| Traffic enforcement | 15–20% | Traffic stops, accident response, DUI patrols. |
| Mental health/crisis response | 10–15% | Includes wellness checks, suicide threats, public disturbance by ill. |
| Domestic disputes (non-criminal) | 8–10% | Often not arrests, but de-escalation or mediation. |
| Serving civil papers/warrants | 5–10% | Evictions, subpoenas, restraining orders. |
| Unhoused and drug-related calls | 5–8% | Often repeat calls involving no major criminal conduct. |
| Community engagement/patrol | 10–15% | Walking, driving, presence patrols, public events. |
| Administrative/paperwork time | 20–30% | Report writing, evidence logging, desk duty. |
Key Takeaways:
Less than 10% of total police time is devoted to responding to serious violent crimes.
A large share is spent on non-criminal social issues, including mental health, homelessness, traffic, and disputes.
Many of these functions could be (and are increasingly being) handled more effectively by civilian crisis responders, social workers, or traffic agencies.
The Cost of Policing
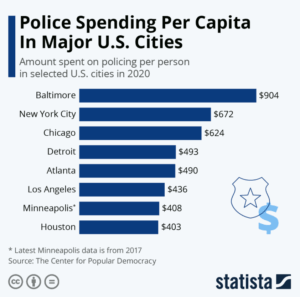
Source: Statista.com
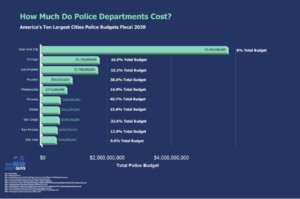
Source: TheCostGuys
Neighborhoods with more police presence also experience more violent crimes
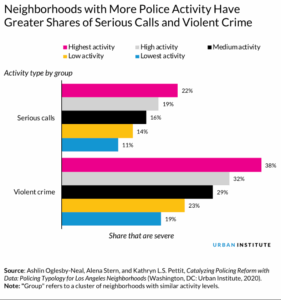
This correlation doesn’t necessarily imply direct and immediate causation. In fact, research suggests that increased policing in certain areas can often exacerbate issues rather than resolve them.
The observed correlation between higher police presence and increased crime rates in certain neighborhoods can be attributed to several factors:
- Targeted Policing in High-Crime Areas: Police departments often allocate more resources to areas with higher reported crime rates, leading to increased police presence. This can create a feedback loop where more policing leads to more recorded incidents, not necessarily more actual crime.
- Over-Policing and Community Relations: Increased police presence, especially in marginalized communities, can strain relationships between law enforcement and residents. This tension can lead to underreporting of crimes and decreased cooperation, hindering effective policing.
- Displacement of Crime: Some studies suggest that aggressive policing in one area can push criminal activities to neighboring regions, rather than eliminating them.
- Last but not least, the perpetuation of police violence onto communities also increases the violent responses within the community. It’s a blowback loop.
Race Statistics in U.S. Policing
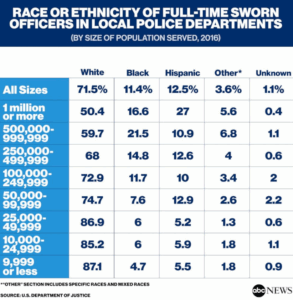
Source: ABC News
Police violence has profound and lasting effects on community well-being. Research indicates that aggressive policing and incidents of police violence not only harm individuals directly involved but also lead to broader community trauma, increased distrust, and, unsurprisingly also paradoxically, can contribute to elevated levels of violence within those communities.
The Ripple Effects of Police Violence
- Erosion of Community Trust and Cooperation: High-profile incidents of police violence often lead to a significant decline in community members’ willingness to engage with law enforcement. This includes reduced reporting of crimes and decreased participation in community policing initiatives, which can hinder effective crime prevention and resolution.
- Mental Health Impacts: Exposure to police violence, whether direct or indirect, has been linked to adverse mental health outcomes, including increased rates of depression, anxiety, and post-traumatic stress disorder among community members.
- Perpetuation of Violence: The presence of aggressive policing tactics can escalate tensions within communities, sometimes leading to increased incidents of violence. This phenomenon, often referred to as “blowback,” suggests that the very measures intended to suppress violence may, in some contexts, exacerbate it.
- Disproportionate Impact on Marginalized Communities: Communities of color, particularly Black communities, often bear the brunt of aggressive policing strategies. This disproportionate exposure contributes to systemic inequalities and can lead to cycles of violence and incarceration that are difficult to break.
The Surging Cost of Policing, 1980s to Present
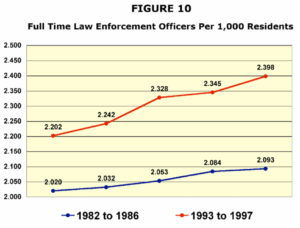
Source: ResearchGate
Total Annual Police Spending in the U.S.
As of the most recent data:
- State and Local Governments: Approximately $176.8 billion was spent on police protection in 2023.
- Federal Government: In fiscal year 2021, the federal government allocated about $71.9 billion to law enforcement and prisons.
Combined Total: Over $248.7 billion is spent annually on policing and related activities across all levels of government.
Breakdown by Government Level
- Federal Level
- Agencies Involved: Includes the FBI, DEA, ATF, U.S. Marshals Service, and others.
- Spending: Approximately $71.9 billion in FY2021.
- State and Local Level
- Local Police Departments: Employed about 473,000 full-time sworn officers and 126,000 full-time civilian personnel in 2020.
- Per Capita Spending: Varies by state; for example, New York spent approximately $530 per person, while California spent about $487 per person on state and local police expenditures in fiscal year 2017.
👮 Total Number of Police Officers
- Sworn Officers: As of 2022, there were approximately 849,915 police officers in the United States. It is estimated that there currently are more than 1 million.
- Federal Law Enforcement Officers: Customs and Border Protection (CBP) employed the highest number, with 46,993 officers, representing about 34% of all federal law enforcement officers.
💰 Average Cost per Officer
Local Level: The average cost per police officer, including part-time employees, is approximately $192,940.